Memory Chisel
Think now, Think deeper
What are obesity and overweight
Overweight and obesity are defined as abnormal or excessive fat accumulation that may impair health.
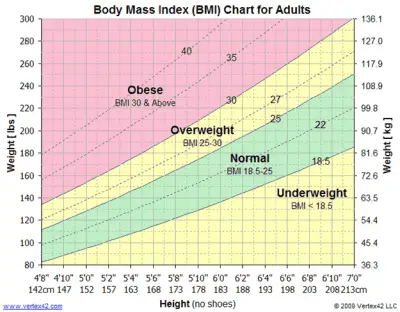
Body mass index (BMI) is a simple index of weight-for-height that is commonly used to classify overweight and obesity in adults. It is defined as a person’s weight in kilograms divided by the square of his height in meters (kg/m2).
For adults, WHO defines overweight and obesity as follows:
BMI provides the most useful population-level measure of overweight and obesity as it is the same for both sexes and for all ages of adults. However, it should be considered a rough guide because it may not correspond to the same degree of fatness in different individuals.
For children, age needs to be considered when defining overweight and obesity.
For children under 5 years of age:
Overweight and obesity are defined as follows for children aged between 5–19 years:
Some recent WHO global estimates follow.
In 2019, an estimated 38.2 million children under the age of 5 years were overweight or obese. Once considered a high-income country problem, overweight and obesity are now on the rise in low- and middle-income countries, particularly in urban settings. In Africa, the number of overweight children under 5 has increased by nearly 24% percent since 2000. Almost half of the children under 5 who were overweight or obese in 2019 lived in Asia.
Over 340 million children and adolescents aged 5-19 were overweight or obese in 2016.
The prevalence of overweight and obesity among children and adolescents aged 5-19 has risen dramatically from just 4% in 1975 to just over 18% in 2016. The rise has occurred similarly among both boys and girls: in 2016 18% of girls and 19% of boys were overweight.
While just under 1% of children and adolescents aged 5-19 were obese in 1975, more 124 million children and adolescents (6% of girls and 8% of boys) were obese in 2016.
Overweight and obesity are linked to more deaths worldwide than underweight. Globally there are more people who are obese than underweight – this occurs in every region except parts of sub-Saharan Africa and Asia.
The fundamental cause of obesity and overweight is an energy imbalance between calories consumed and calories expended. Globally, there has been:
Changes in dietary and physical activity patterns are often the result of environmental and societal changes associated with development and lack of supportive policies in sectors such as health, agriculture, transport, urban planning, environment, food processing, distribution, marketing, and education.
Raised BMI is a major risk factor for noncommunicable diseases such as:
The risk for these noncommunicable diseases increases, with increases in BMI.
Childhood obesity is associated with a higher chance of obesity, premature death and disability in adulthood. But in addition to increased future risks, obese children experience breathing difficulties, increased risk of fractures, hypertension, early markers of cardiovascular disease, insulin resistance and psychological effects.
Many low- and middle-income countries are now facing a “double burden” of malnutrition.
Children in low- and middle-income countries are more vulnerable to inadequate pre-natal, infant, and young child nutrition. At the same time, these children are exposed to high-fat, high-sugar, high-salt, energy-dense, and micronutrient-poor foods, which tend to be lower in cost but also lower in nutrient quality. These dietary patterns, in conjunction with lower levels of physical activity, result in sharp increases in childhood obesity while undernutrition issues remain unsolved.
Overweight and obesity, as well as their related noncommunicable diseases, are largely preventable. Supportive environments and communities are fundamental in shaping people’s choices, by making the choice of healthier foods and regular physical activity the easiest choice (the choice that is the most accessible, available and affordable), and therefore preventing overweight and obesity.
At the individual level, people can:
Individual responsibility can only have its full effect where people have access to a healthy lifestyle. Therefore, at the societal level it is important to support individuals in following the recommendations above, through sustained implementation of evidence based and population based policies that make regular physical activity and healthier dietary choices available, affordable and easily accessible to everyone, particularly to the poorest individuals. An example of such a policy is a tax on sugar sweetened beverages.
The food industry can play a significant role in promoting healthy diets by:
Adopted by the World Health Assembly in 2004 and recognized again in a 2011 political declaration on noncommunicable disease (NCDs), the “WHO Global Strategy on Diet, Physical Activity and Health” describes the actions needed to support healthy diets and regular physical activity. The Strategy calls upon all stakeholders to take action at global, regional and local levels to improve diets and physical activity patterns at the population level.
The 2030 Agenda for Sustainable Development recognizes NCDs as a major challenge for sustainable development. As part of the Agenda, Heads of State and Government committed to develop ambitious national responses, by 2030, to reduce by one-third premature mortality from NCDs through prevention and treatment (SDG target 3.4).
The “Global action plan on physical activity 2018–2030: more active people for a healthier world” provides effective and feasible policy actions to increase physical activity globally. WHO published ACTIVE a technical package to assist countries in planning and delivery of their responses. New WHO guidelines on physical activity, sedentary behavior and sleep in children under five years of age were launched in 2019.
The World Health Assembly welcomed the report of the Commission on Ending Childhood Obesity (2016) and its 6 recommendations to address the obesogenic environment and critical periods in the life course to tackle childhood obesity. The implementation plan to guide countries in taking action to implement the recommendations of the Commission was welcomed by the World Health Assembly in 2017.
SOURCE: Obesity and overweight (who.int)

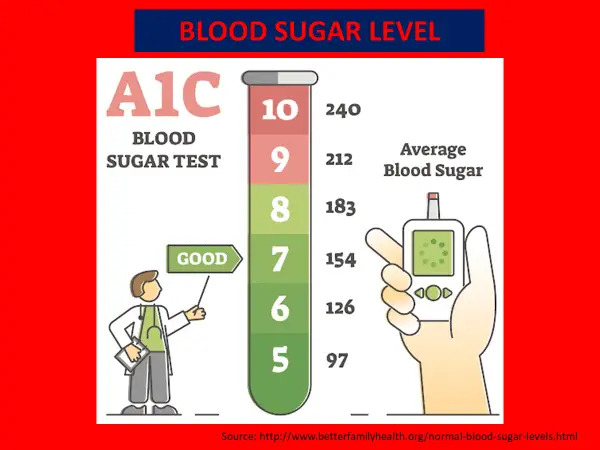
File this one under “it’s complicated.” As your BMI rises, your risk for health problems increases as well. For example, people who have BMIs in the overweight or obesity ranges are at higher risk for developing diabetes than people in the normal range.
“That risk may be twice as high,” says Dr. Heinberg. “But when you look at people whose BMIs are more than 40, the risk may increase to 20 times higher.”
BMI is an exercise in health probability. Does a high BMI mean you automatically have poor health? No. Does it dramatically increase your risk of poor health? Absolutely.
For example, not everyone who has a BMI over 40 has diabetes. But many more people with BMIs over 40 have diabetes than people in the overweight or normal weight range.
“A too-high or too-low BMI is not an ironclad guarantee that you will develop a chronic disease,” notes Dr. Heinberg. “Rather, it’s an important piece of information that you and your primary healthcare provider should look at within the context of evaluating you as a whole person.”
Some exceptions can make BMI seem more like a Magic 8 Ball, though. Factors that can make BMI not accurate include:
When it comes to BMI, all races and ethnicities are lumped together — and that can lead to unclear and confusing results. More and more research shows that there are biological and genetic differences in the relationship between weight, muscle mass and disease risk among different groups of people. BMI does not account for that.
Certain genetic factors can affect BMI accuracy because of their effect on weight distribution and muscle mass. For example, a 2011 study showed that Black women had less metabolic risk at higher BMIs than white women. Another showed that Mexican American women tend to have more body fat than white and Black women.
Other research shows that for people of Asian or Middle Eastern descent, even a lower BMI may be misleading. They have a higher risk for metabolic diseases like diabetes at a lower BMI than people of European descent.
“The cutoffs we use may miss some people who are high risk and may need earlier intervention,” Dr. Heinberg notes. “They might not get the preventive care they need since they look at their lower BMI and think, ‘Great, I’m in good health, I don’t need to do anything’.”
People who are athletic tend to have a higher percentage of lean muscle mass and a lower percentage of fat mass than the average population. These factors can throw a wrench in their BMI measurements. They might measure in the overweight category (or higher) despite having great overall health.
Being pear- or apple-shaped doesn’t just affect clothing preferences. “BMI does not take waist circumference into account,” explains Dr. Heinberg. “Two people can weigh the same and, therefore, have the same BMI. But their risk for disease might not be the same.
“Say Person A has a higher waist circumference, carrying their weight in their abdomen. Person B carries their weight lower in their body. Person A has a higher risk of metabolic and cardiovascular disease, but their identical BMI doesn’t tell that story,” she notes.
Older adults tend to have more body fat and less muscle mass — but that’s not necessarily a bad thing. Studies show that BMIs in the high-normal to overweight range may protect older adults from developing certain diseases and dying early.
Think of BMI like a puzzle piece: It’s a part of your whole health picture. Other valuable pieces include:
“Knowing a patient’s lean muscle mass versus fat mass may be more informative than BMI, but it’s hard to measure accurately and cheaply,” adds Dr. Heinberg. “Waist circumference is also hard to measure accurately, particularly in patients with greater obesity.
“That’s one of the reasons we rely on BMI. All you need is a scale, stadiometer (which measures height) and calculator,” she says.
Dr. Heinberg’s take-home point: Even with its many exceptions, don’t throw the BMI baby out with the bathwater.
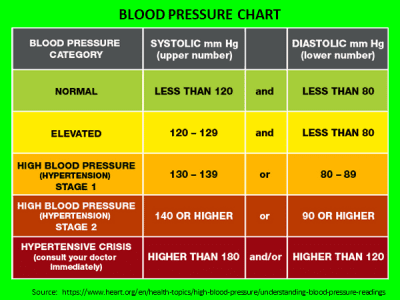
“Blood pressure tells you about cardiovascular risk, but BMI tells you about risk for that and other conditions like cancer, endocrine disorders and sleep apnea,” says Dr. Heinberg. “Knowing someone has obesity based on BMI can lead to a more comprehensive evaluation with their doctor.”
SOURCE: Is BMI an Accurate Measure of Health? – Cleveland Clinic

| NORMAL WEIGHT | OVERWEIGHT | OBESE | |||||||||||||||
| BMI Value: | 19 | 20 | 21 | 22 | 23 | 24 | 25 | 26 | 27 | 28 | 29 | 30 | 31 | 32 | 33 | 34 | 35 |
| Height cms (meters) | Body Weight (kilograms / kg) | ||||||||||||||||
| 147cm (1.47m) | 41 | 44 | 45 | 48 | 50 | 52 | 54 | 56 | 59 | 61 | 63 | 65 | 67 | 69 | 72 | 73 | 76 |
| 150cm (1.50m) | 43 | 45 | 47 | 49 | 52 | 54 | 56 | 58 | 60 | 63 | 65 | 67 | 69 | 72 | 74 | 76 | 78 |
| 152cm (1.52m) | 44 | 46 | 49 | 51 | 54 | 56 | 58 | 60 | 63 | 65 | 67 | 69 | 72 | 74 | 76 | 79 | 81 |
| 155cm (1.55m) | 45 | 48 | 50 | 53 | 55 | 57 | 60 | 62 | 65 | 67 | 69 | 72 | 74 | 77 | 79 | 82 | 84 |
| 157cm (1.57m) | 47 | 49 | 52 | 54 | 57 | 59 | 62 | 64 | 67 | 69 | 72 | 74 | 77 | 79 | 82 | 84 | 87 |
| 160cm (1.60m) | 49 | 51 | 54 | 56 | 59 | 61 | 64 | 66 | 69 | 72 | 74 | 77 | 79 | 82 | 84 | 87 | 89 |
| 163cm (1.63m) | 50 | 53 | 55 | 58 | 61 | 64 | 66 | 68 | 71 | 74 | 77 | 79 | 82 | 84 | 87 | 89 | 93 |
| 165cm (1.65m) | 52 | 54 | 57 | 60 | 63 | 65 | 68 | 71 | 73 | 76 | 79 | 82 | 84 | 87 | 90 | 93 | 95 |
| 168cm (1.68m) | 54 | 56 | 59 | 62 | 64 | 67 | 70 | 73 | 76 | 78 | 81 | 84 | 87 | 90 | 93 | 95 | 98 |
| 170cm (1.70m) | 55 | 57 | 61 | 64 | 66 | 69 | 72 | 75 | 78 | 81 | 84 | 87 | 90 | 93 | 96 | 98 | 101 |
| 172cm (1.72m) | 57 | 59 | 63 | 65 | 68 | 72 | 74 | 78 | 80 | 83 | 86 | 89 | 92 | 95 | 98 | 101 | 104 |
| 175cm (1.75m) | 58 | 61 | 64 | 68 | 70 | 73 | 77 | 80 | 83 | 86 | 89 | 92 | 95 | 98 | 101 | 104 | 107 |
| 178cm (1.78m) | 60 | 63 | 66 | 69 | 73 | 76 | 79 | 82 | 85 | 88 | 92 | 95 | 98 | 101 | 104 | 107 | 110 |
| 180cm (1.80m) | 62 | 65 | 68 | 71 | 75 | 78 | 81 | 84 | 88 | 91 | 94 | 98 | 101 | 104 | 107 | 110 | 113 |
| 183cm (1.83m) | 64 | 67 | 70 | 73 | 77 | 80 | 83 | 87 | 90 | 93 | 97 | 100 | 103 | 107 | 110 | 113 | 117 |
| 185cm (1.85m) | 65 | 68 | 72 | 75 | 79 | 83 | 86 | 89 | 93 | 96 | 99 | 103 | 107 | 110 | 113 | 117 | 120 |
| 188cm (1.88m) | 67 | 70 | 74 | 78 | 81 | 84 | 88 | 92 | 95 | 99 | 102 | 106 | 109 | 113 | 116 | 120 | 123 |
| 191cm (1.91m) | 69 | 73 | 76 | 80 | 83 | 87 | 91 | 94 | 98 | 102 | 105 | 109 | 112 | 116 | 120 | 123 | 127 |
| 193cm (1.93m) | 71 | 74 | 78 | 82 | 86 | 89 | 93 | 97 | 100 | 104 | 108 | 112 | 115 | 119 | 123 | 127 | 130 |
| Height cms (meters) | Body Weight (kilograms / kg) | ||||||||||||||||
| BMI Value: | 19 | 20 | 21 | 22 | 23 | 24 | 25 | 26 | 27 | 28 | 29 | 30 | 31 | 32 | 33 | 34 | 35 |
| NORMAL WEIGHT | OVERWEIGHT | OBESE | |||||||||||||||